


The "Iceberg" Correction
/Since leaving the Chilean coastline, the THOR team has been exploring the sea floor… with sound. Similar to the way that sea mammals communicate with each other over long distances, and submarines avoid obstacles, scientists use sound to “see” the seabed surface and ultimately map the ocean bottom. Sound waves are generated from beneath the ship from an instrument called a multibeam echo sounder. It is in effect a giant loud speaker pointing downwards and away from the vessel on either side.
Here’s how it works. The multibeam sends a “ping” (like you hear in the movies about submarines) which is a pulse or beam of high-pitched sound that moves down and away from the bottom of the ship. Each ping contains 432 individual depth soundings (hence multibeam) in the shape of a fan which is called a swath. The angle and trajectory of each swath of sound, the time traveled and distance away from the source of sound combined with the properties of the ocean (temperature and salinity) are used to calculate the velocity of that sound through water. The result is an “image” of sound velocity, where the swath’s width is the maximum angle the outermost depth soundings have achieved as they travel some distance (denoted by color) to the seafloor and back.
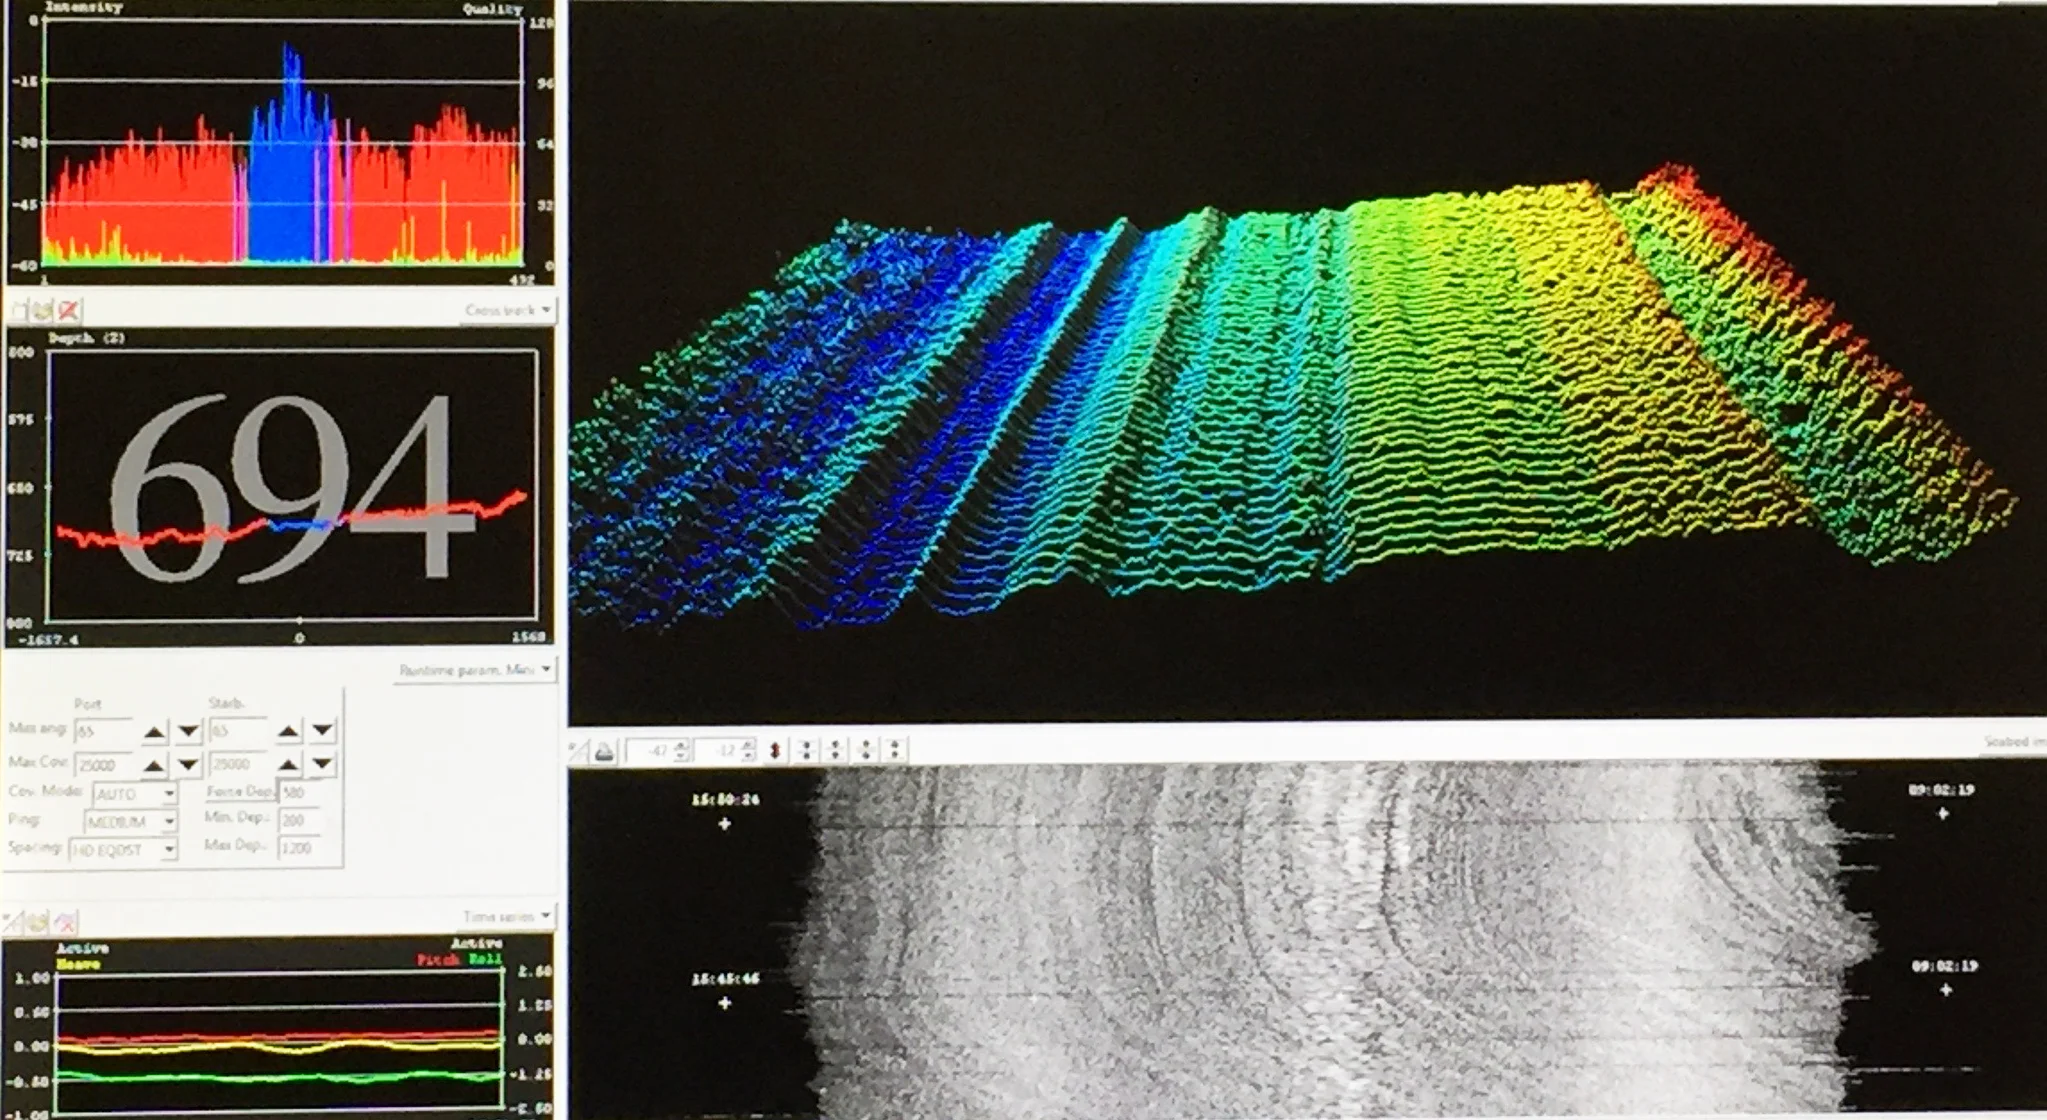
Each “ping” is displayed as a line of points. This image shows multiple pings. Each “ping” line is composed of 432 depth soundings – you may even be able to see the individual points. )
So for deeper water, the swath will be wider and for shallower water, the swath will narrow. Each of the reflected soundings are then processed to show a continuous colorful ribbon, or snail trail of the seafloor below the ship. The colors are equivalent to the distance the sound wave has travelled through the depth of the water, where the longest distances, which are blue, represent the deepest parts and the red colors are shallower features. Collectively they “paint” a picture of the seafloor’s surface in three dimensions.
Most oceanographic research vessels employ the multibeam echo sounder whenever they can, the combined results of which can paint a detailed picture of processes that we could never witness ourselves through the depths of the ocean. Marine geologists, oceanographers and glaciologists studying Thwaites Glacier will use this information to unravel the present and past processes operating between the ocean and the ice shelves. Features such as furrows and plough marks indicate past movement of the ice shelf and icebergs dragging along the sea floor, channels show where water flowed beneath past ice sheets, and high ridges or peaks may have been places where ice was once “grounded” (or resting on) the sea bed, a situation which may act to stabilize an ice shelf or glacier, and allay or even stop its’ backwards retreat.

Seafloor bathymetry off of the Cosgrove Islands, Antarctica. This broader image is assembled from many transits by the ship, each with a sonar image of the seafloor below.

Ali Graham and Kelly Hogan examining seafloor bathymetry data gathered by the multibeam Echo sounder.
The science team also use these echo sounders to make decisions about where to gather samples from the sea floor by producing an image of the layers of muds, sands and rocks just below the surface. The samples help to decipher a longer term history of how ice interacted with the ocean, and ultimately how the ice will behave in the future. The accuracy of the data is critical to ensuring that the location where those samples are taken will not be in a place that might damage the instruments (coring devices) used to collect the samples.
An important part of collecting accurate multibeam data is accounting for a variety of physical parameters. On the ship, we are effectively a bobbing cork in the ocean. Combined with the echo sounder, a set of reference points are made with each “ping” to account for this unpredictable motion. Similar to how a gyroscope works, the reference point data accounts for real time conditions such as roll (side to side) pitch (forward and backward motion), heave (the up and down motion) and yaw (the horizontal or side to side motion). The data processing software then applies clever corrections to make sure that the data accurately represent the true position and orientation of each sea floor sounding.
Two days after the ships passage through rough seas, THOR team scientists Kelly Hogan and Ali Graham noticed that the seafloor bathymetry data output suggested that the seafloor had a tilt when they knew it should have been flat. In order to understand if the tilt was real, they needed to do an experiment. They would have to track back over area that had already been scanned, but in the opposite direction. The difference in the two data sets would show an equal and opposite tilt (if they were right that the tilt was in error) and it would help them calculate the degree of that error. In order to accomplish this, the seafloor would have to be flat and they would need about an hour’s worth of backtrack scanning of the same flat seafloor.
Icebergs are made of freshwater ice and compacted snow. They typically originate from the breakup of glaciers and ice shelves that terminate in the ocean.
Enter the icebergs.
The first significant iceberg that appeared was close enough to provide a terrific photo opportunity, so the crew of Nathaniel B. Palmer made a spontaneous viewing loop around the iceberg. The ship had also entered the Bellingshausen Abyssal Plain in the Southeast Pacific Basin, the flattest area of the transit before reaching the Antarctic continental shelf. So the sea floor conditions were optimum.

Sonar image of our maneuver around the iceberg!
Another iceberg on the horizon looked to provide the appropriate distance and time it would take to conduct the necessary experiment. Using the new iceberg as a goal post, they made the first multibeam swath, closely rounding the iceberg (which was as photogenic as the first) and then retracing the initial snail trail long enough to determine the degree of error and apply the correction.

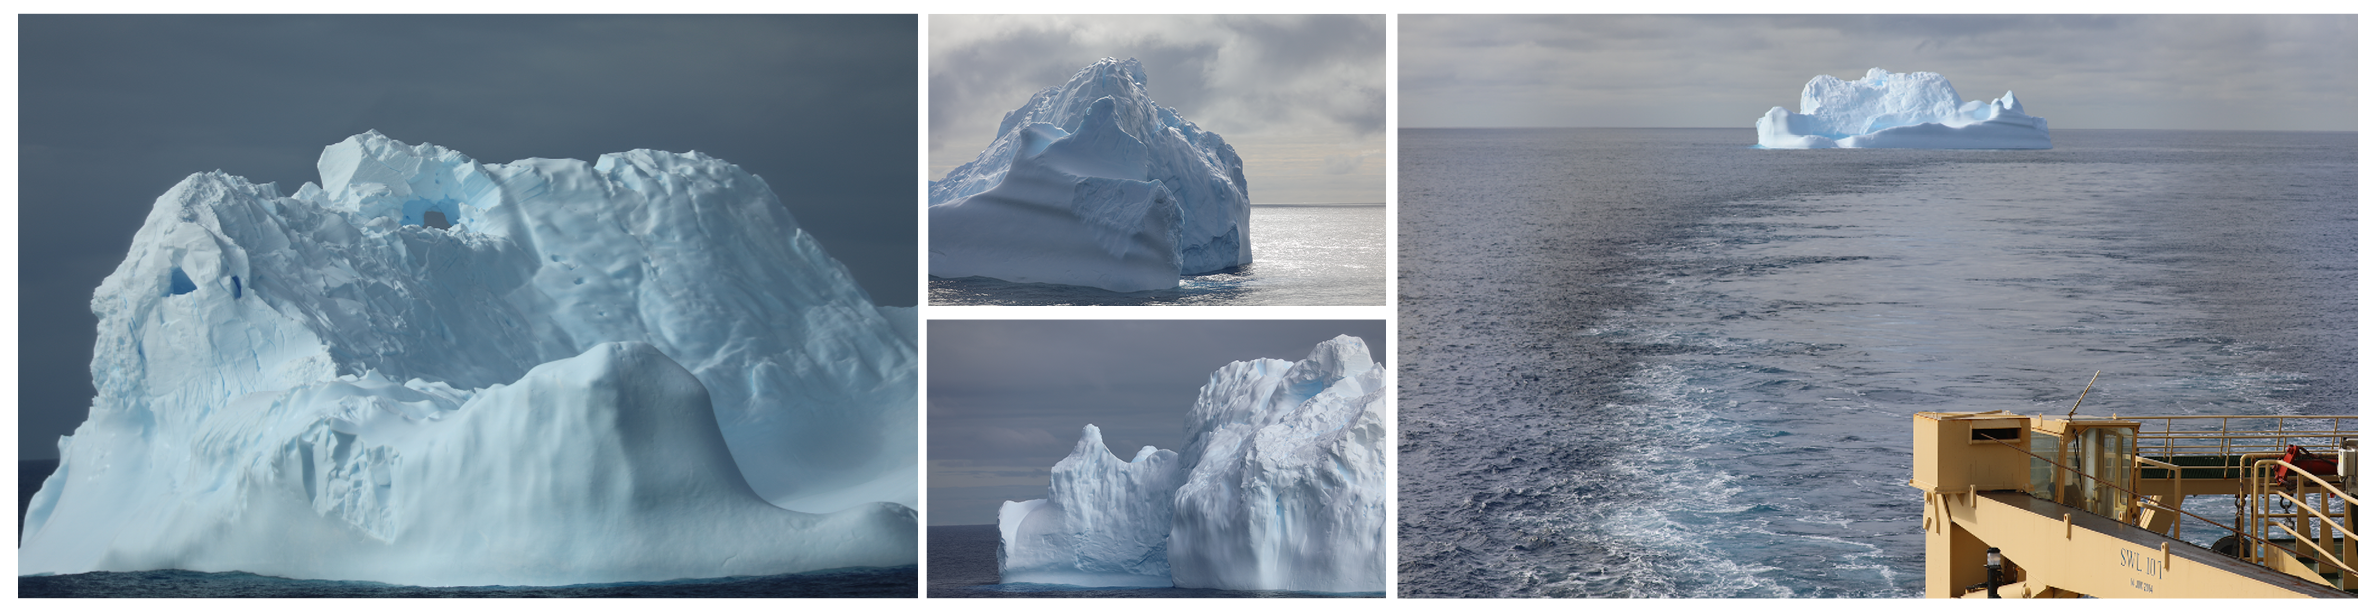
These icebergs which originated from Antarctica may be at least a year old, but their location in warmer waters will melt them very quickly, as much of their rounded surfaces are already showing.
Two icebergs later, the problem is solved and the colorful ribbon of seafloor bathymetry is returned to its horizontal self. These kinds of corrections are not uncommon and ensure that the data are good for when the THOR team reach Thwaites itself, where the accuracy of the sea floor measurements will be important for selecting the best area of sea floor to sample to interpret its history.
Here are some of the other icebergs we have seen on our traverse through the Amundsen Sea. Icebergs are categorized by shape, age and how they formed.

This is classified as a tabular berg - a blocky, multi-year, freshwater ice berg because of its steep sides and flat top.
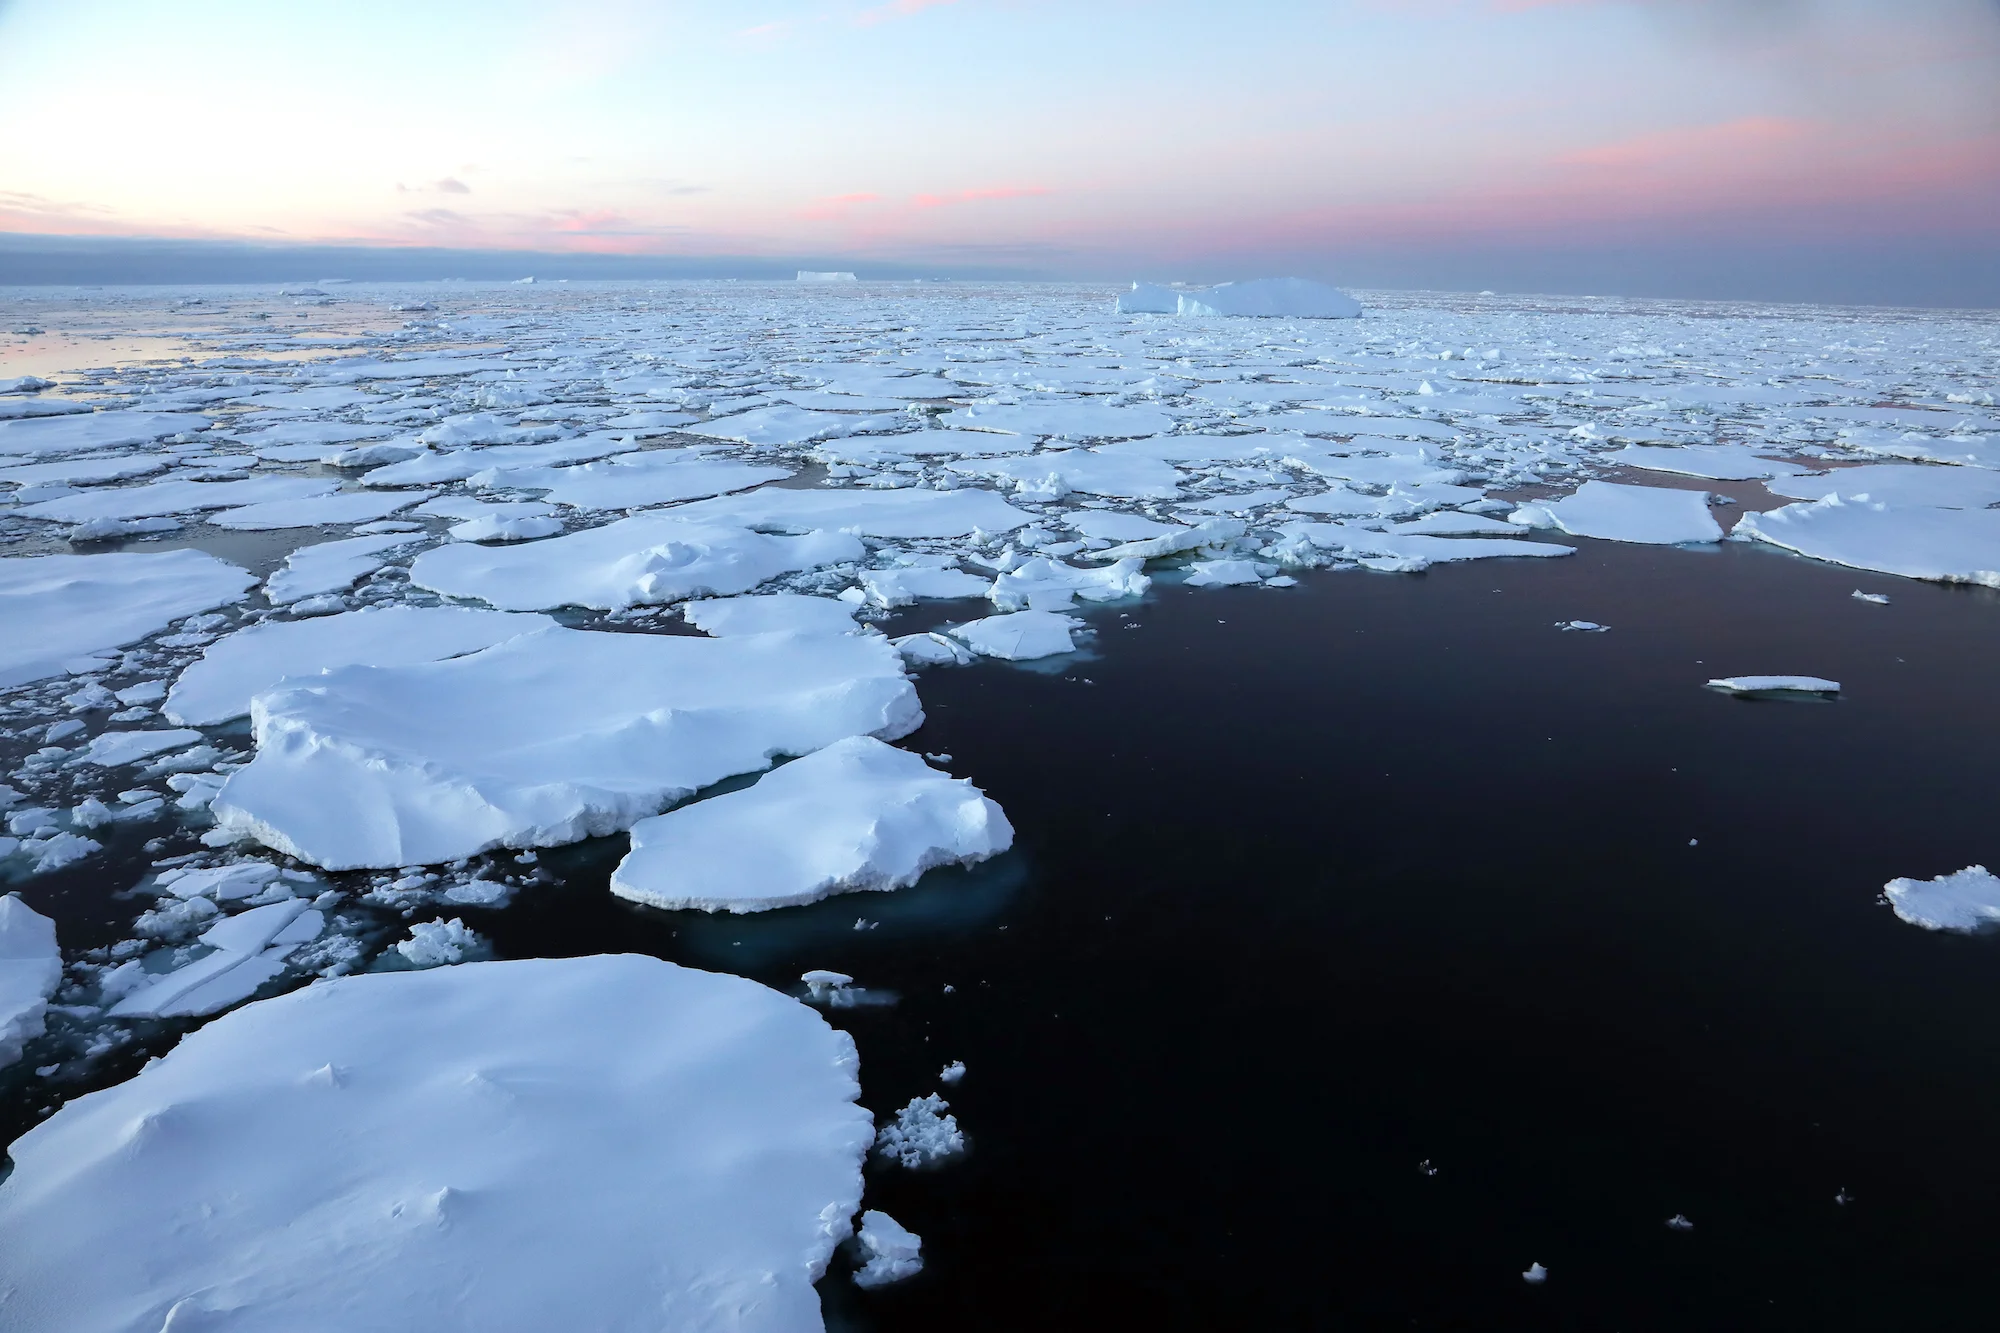
Drift sea ice is young flat ice floes formed from sea water at the sea surface that can move with current or winds.
Other iceberg pics….
Sea ice (foreground) with an iceberg protruding and more bergs on the horizon.
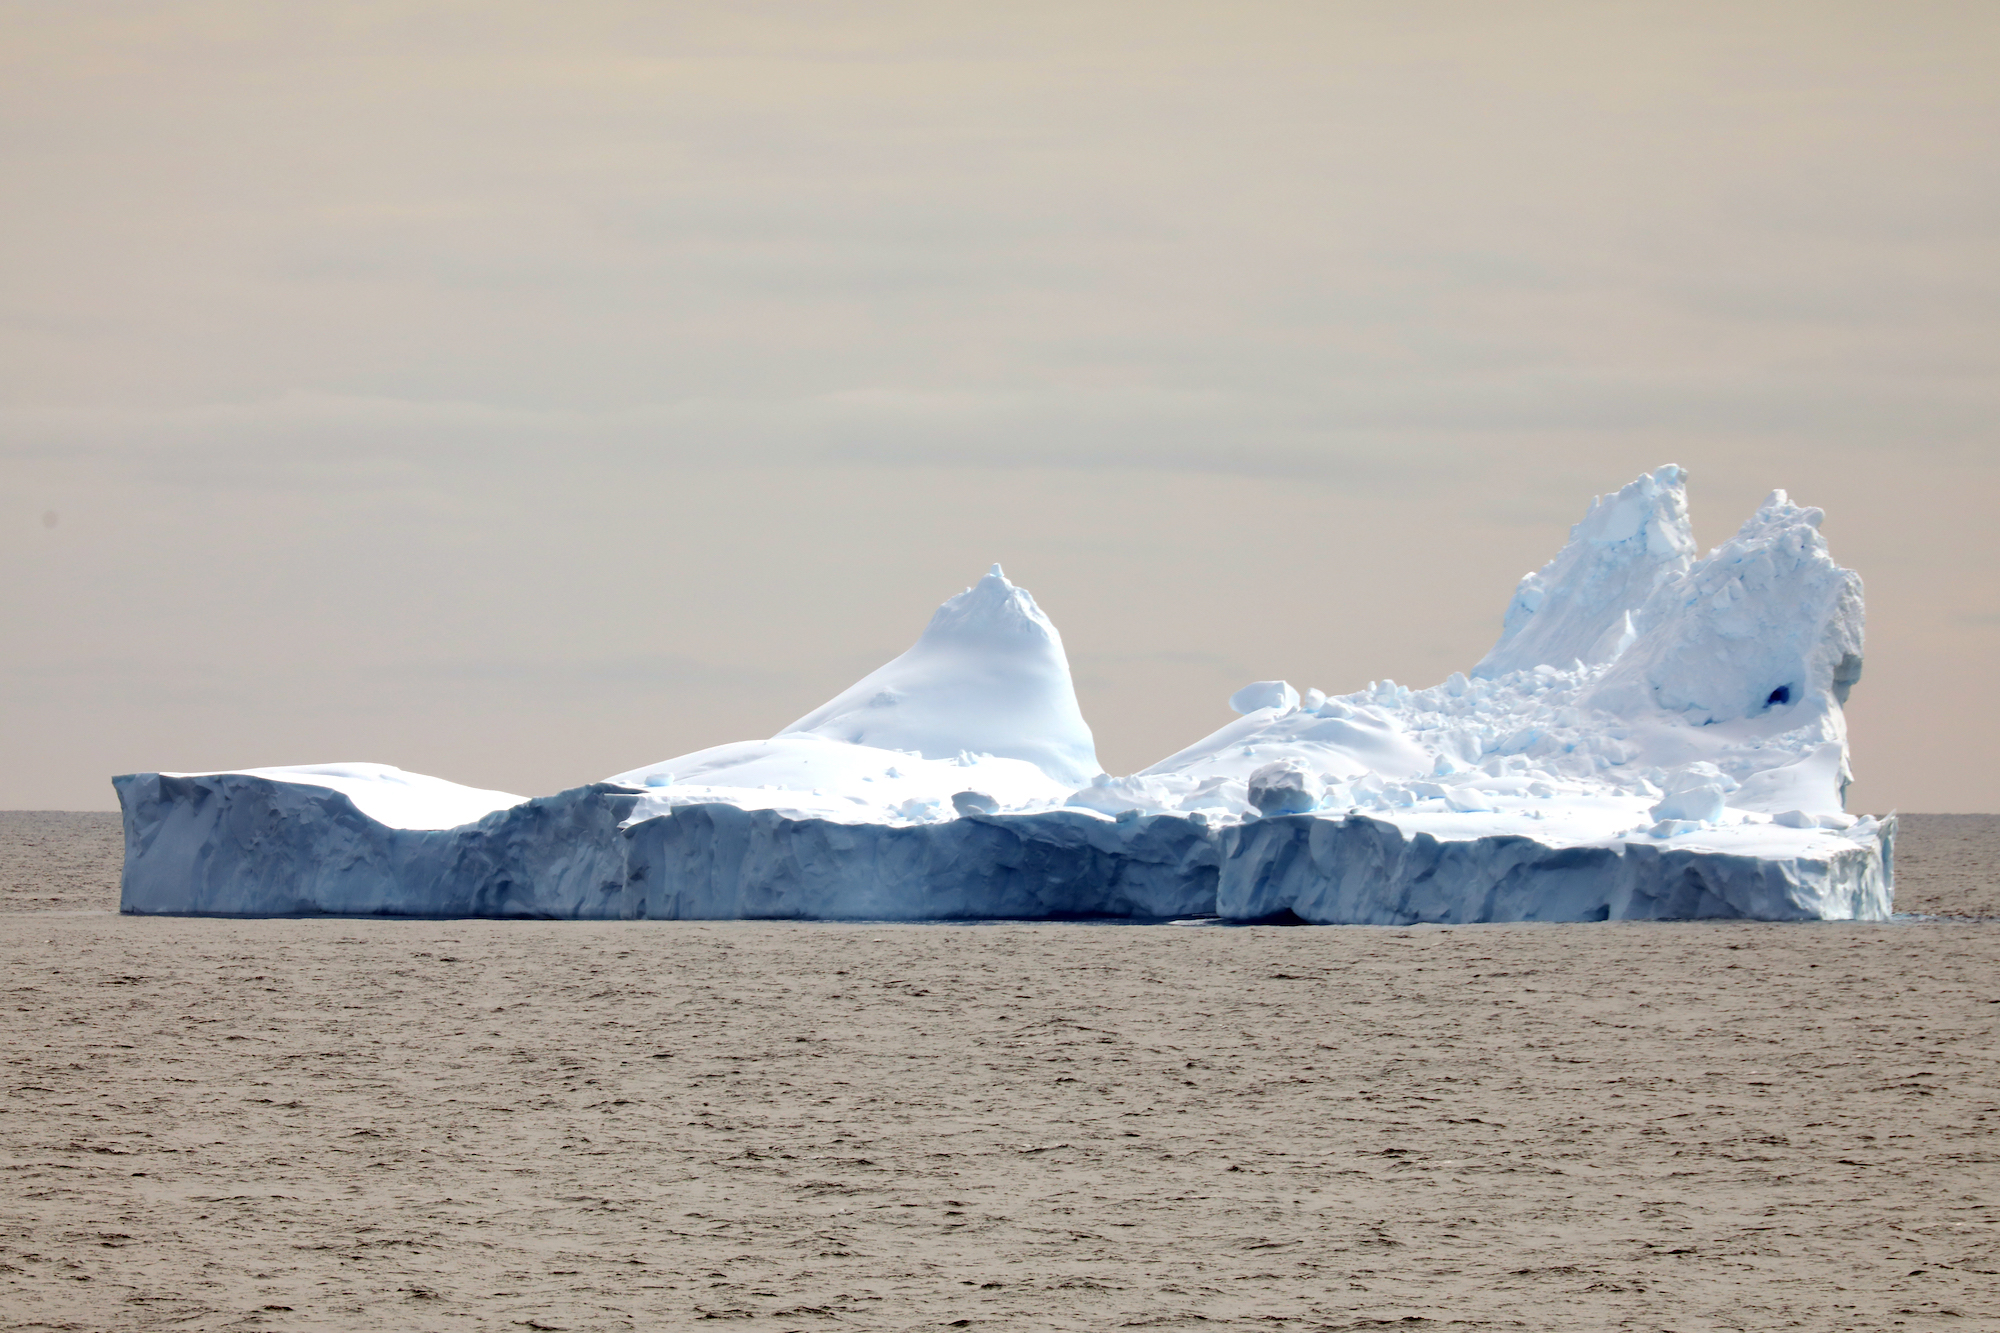
As icebergs age, they melt and crumble to produce amazing sculpture.

Penguins! Penguins like ice. Ice makes them happy.
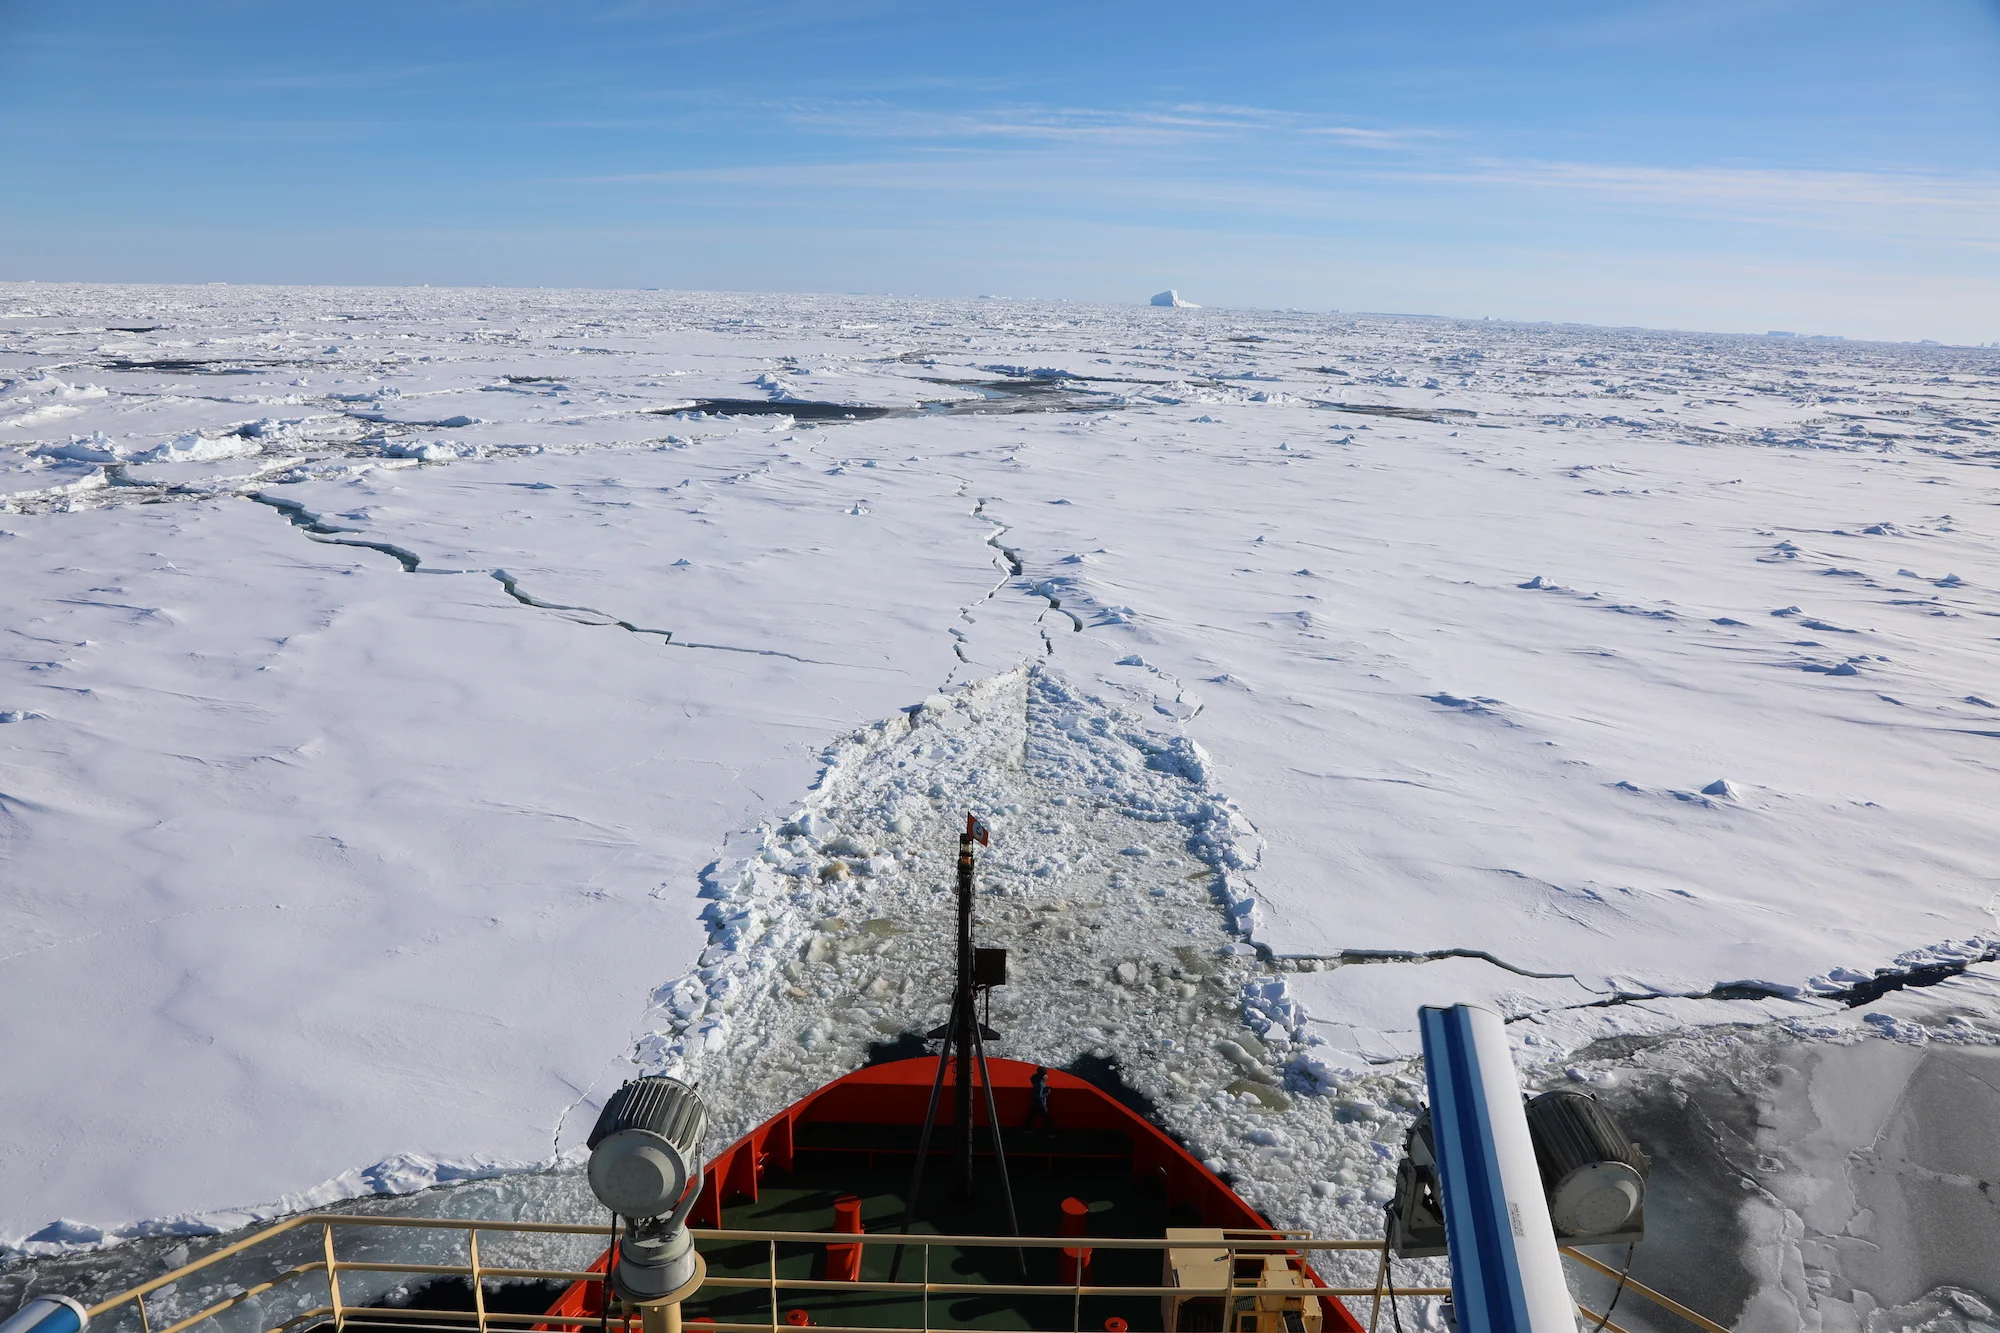
Here’s the Palmer nosing its way through sea ice. Icebreakers like the Palmer do not crash through ice, but ride up on top of it and crush the ice with the ship’s weight. Sometimes it takes several tries, and you can see here where the Palmer rode up onto this ice leaving an impression from the hull and long cracks through the ice.
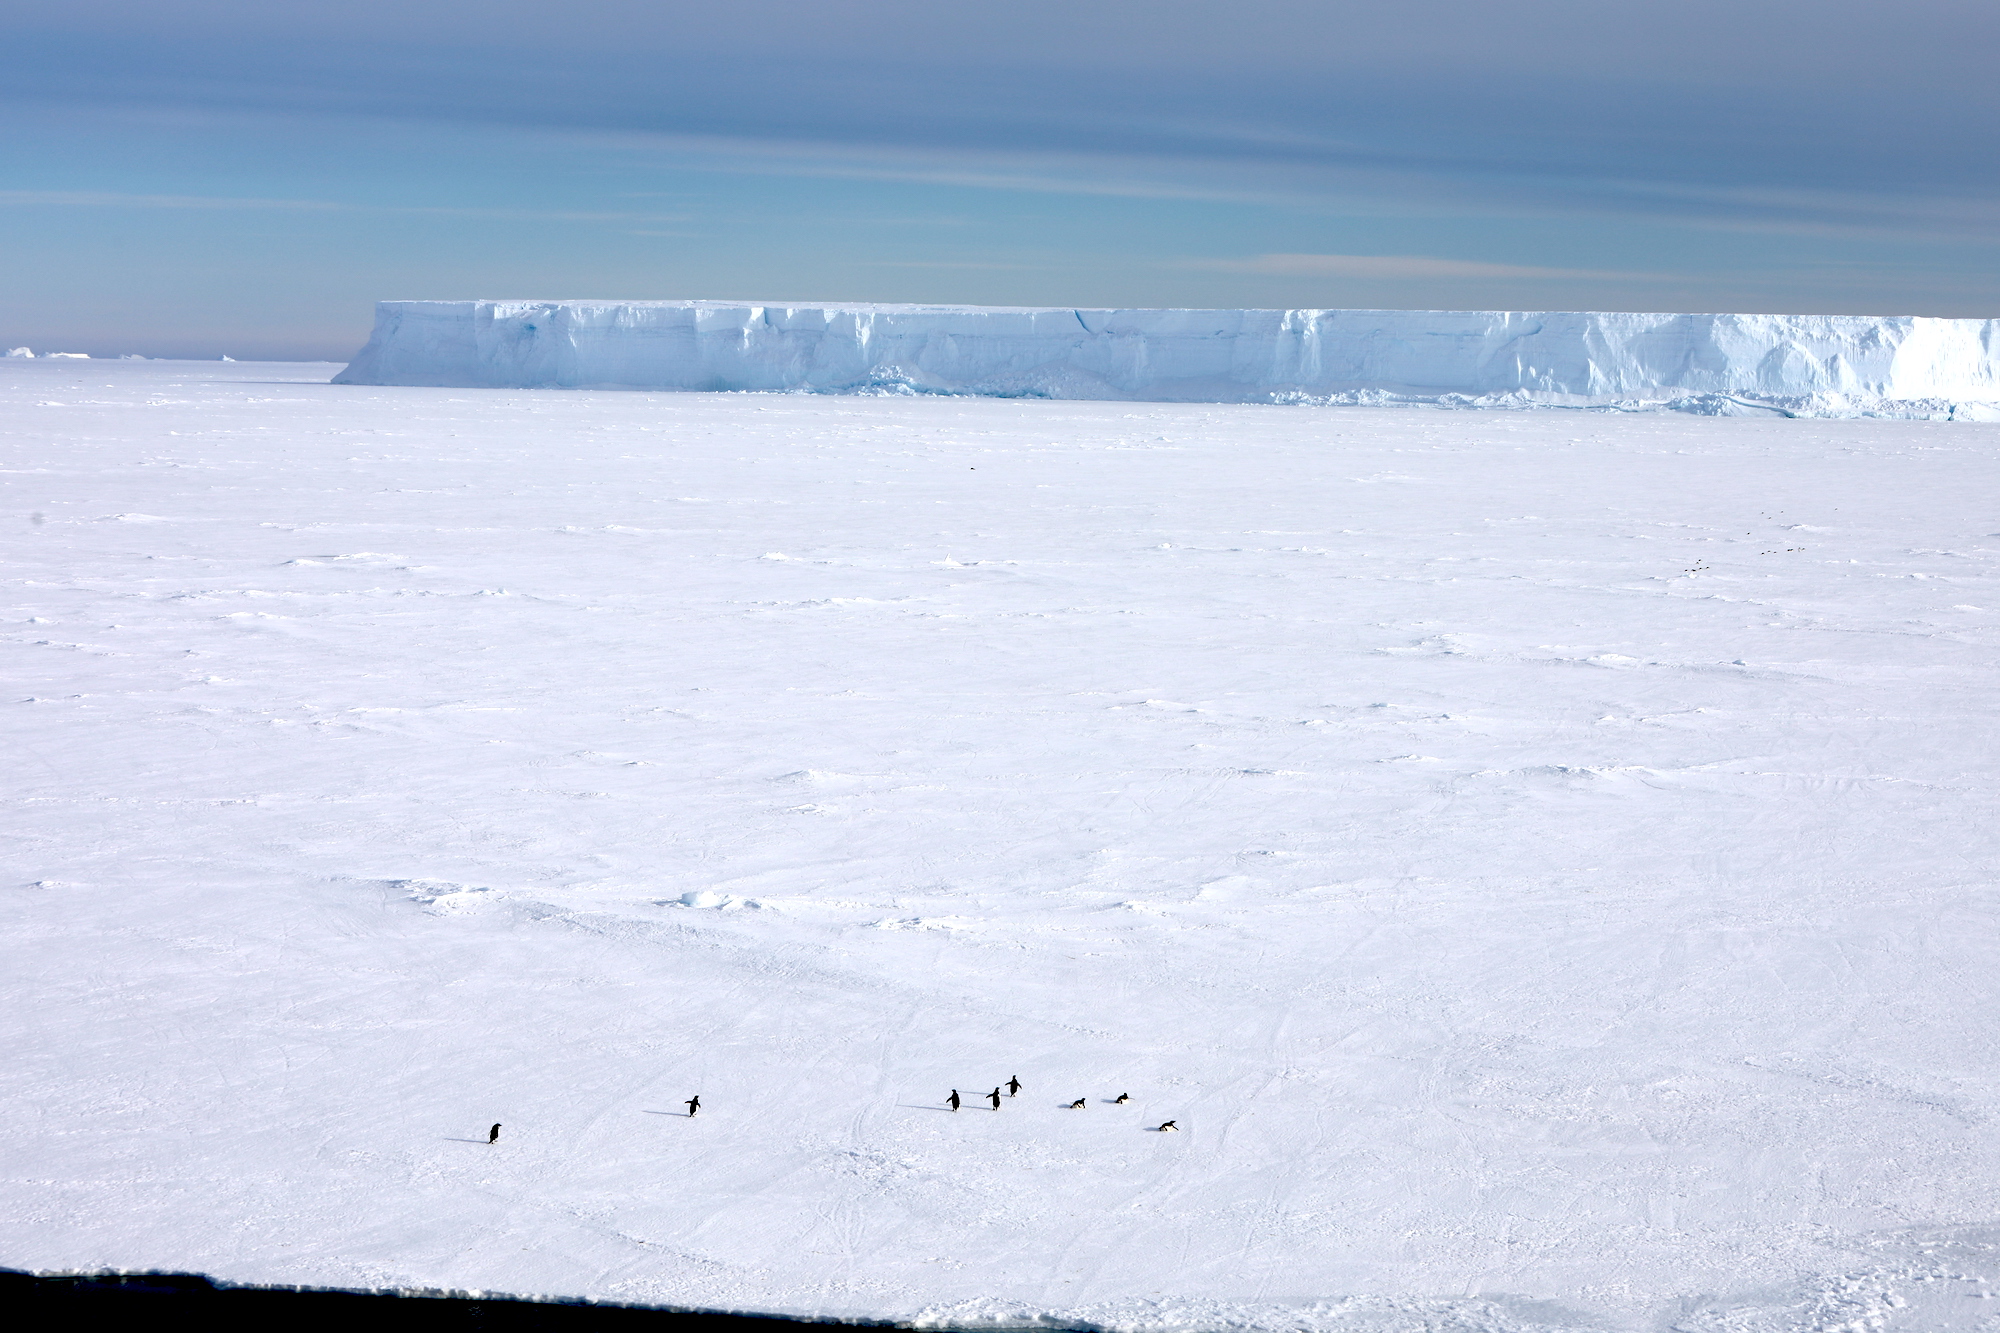
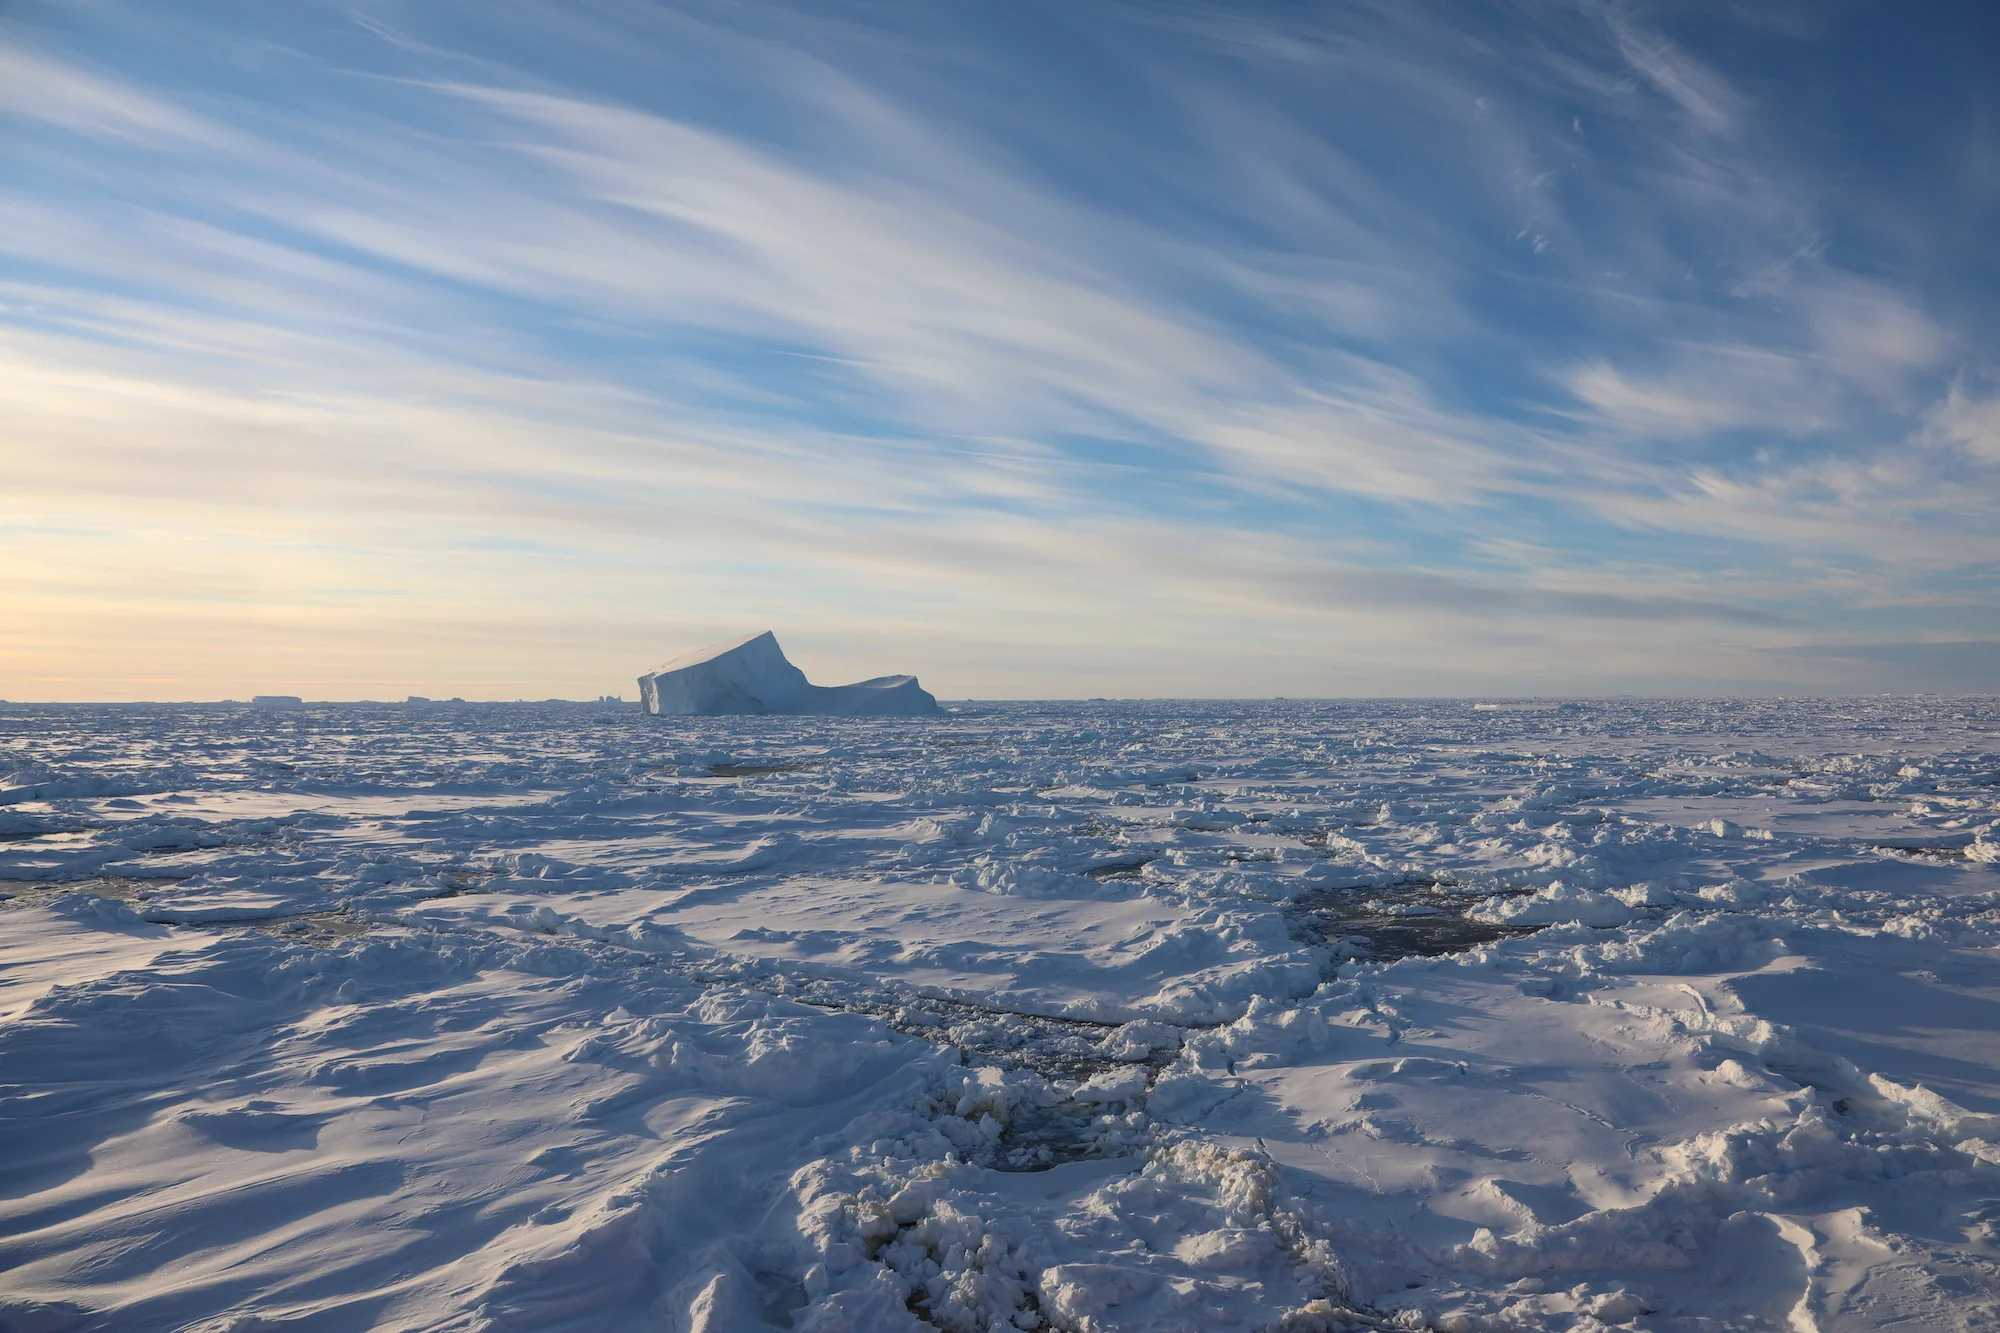
Landfast ice or “Fast” ice is multi-year flat, solid ice made of both seawater and fresh water (from snow) that is attached to the far continental margin and can include grounded icebergs such as the one in the background). Note the penguins in the foreground!